

pyramid_debugtoolbar
Overview
pyramid_debugtoolbar provides a debug toolbar useful while you’re
developing a Pyramid application.
pyramid_debugtoolbar is a blatant rip-off of Michael van Tellingen’s
flask-debugtoolbar (which itself was derived from Rob Hudson’s
django-debugtoolbar). It also includes a lightly sanded down version of
the Werkzeug debugger code by Armin Ronacher and team.
Warning
This package only works with Pyramid 1.2a1 and better.
Installation
Install using setuptools, e.g. (within a virtualenv):
$ easy_install pyramid_debugtoolbar
Setup
Once pyramid_debugtoolbar is installed, you must use the
config.include mechanism to include it into your Pyramid project’s
configuration. In your Pyramid project’s __init__.py:
config = Configurator(.....)
config.include('pyramid_debugtoolbar')
Alternately, instead of using the Configurator’s include method, you can
activate Pyramid by changing your application’s .ini file, use the
following line:
pyramid.includes = pyramid_debugtoolbar
Warning
The debug toolbar should never be enabled in a production environment or on a machine with its Pyramid HTTP port exposed directly to the internet; it allows arbitrary code execution from only semi-trusted sources when configured poorly.
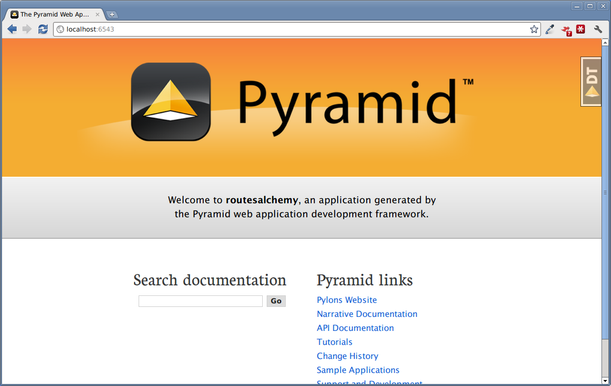
Once Pyramid is restarted, whenever an HTML response is generated by your
Pyramid application, it will include the debug toolbar as a floating element
on right hand side of the page. Additionally, if f the configuration setting
debugtoolbar.intercept_exc is debug (the default), when an exception
is raised by your application, a “pretty” traceback will be shown with inline
debugging controls that will allow you to evaluate arbitrary Python
expressions within the traceback page. A URL leading to a debugging page for
each exception raised by your application will additionally be logged to the
console.
Note
The HTML returned by your Pyramid application must contain a
</body> end-body tag for the toolbar to be injected into a response.
Note
The debug toolbar now loads and uses its own modified version of RequireJS to load its scripts. You no longer need to add it to RequireJS’s path configuration and ask RequireJS to load it.
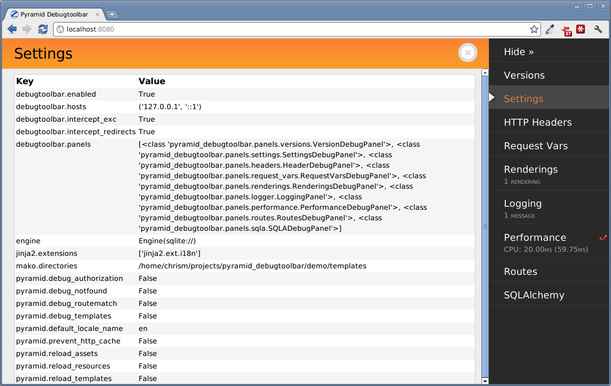
Settings
Settings can be used to control the operation of the toolbar. These settings
are typically specified in the Pyramid “app” section of the Pyramid .ini
file.
debugtoolbar.hosts
If the request’s REMOTE_ADDR is not in this list, the toolbar will not be displayed and the exception handler will not be active. Default: [‘127.0.0.1’, ‘::1’]. Note that each of the values in the list can be a hostmask e.g. (
192.168.1.0/24).This should be a list if setup is done in Python or, if defined in a Paste ini file, a single-line list of IP addresses/hostmasks separated by spaces. For example:
debugtoolbar.hosts = 192.168.1.1 192.168.2.0/24To enable access from any host, use the hostmask
0.0.0.0/0.
debugtoolbar.enabled
trueif the toolbar is enabled;falseif the toolbar is disabled. Default:true. This disables both the exception handler and the toolbar overlay.
debugtoolbar.intercept_exc
This setting can have one of three values:display,debugorfalse. Default:debug. If this value isdisplay, the toolbar will display a “pretty” traceback page which allows source viewing and when an exception happens. If this value isdebug, the “pretty” traceback page will be shown, but it will also contain interactive debugging controls which allow you to evaluate arbitrary Python expressions in the context of a portion of the traceback, which is useful when attempting to track down the cause of the exception. If this value isfalse, the “pretty” traceback will be disabled and all exceptions will be raised to the caller of the Pyramid application (usually a WSGI server). Default:debug. This setting differs fromdebugtoolbar.enabled: it only enables or disables the exception handler. Note that, for backwards compatibility purposes, the valuetrueprovided to this setting is interpreted asdebug.
debugtoolbar.eval_exc
trueif real-time exception debugging is enabled whenintercept_excis true;falseif real-time exception debugging is disabled. Default:true. This differs fromdebugtoolbar.intercept_exc: it only controls whether the pretty exception rendering displays real-time in-browser debugging controls. The real-time in-browser debugging controls allow you to evaluate arbitrary Python expresssions in the context of a stack frame via a browser control.
debugtoolbar.show_on_exc_only
Default:false. If set totruethe debugtoolbar will only be injected into the response in case a exception is raised. If the response is processed without exception the returned html code is not changed by the debugtoolbar at all. This option allows the developer to use the toolbar for debugging purposes without interfering with successful responses. E.g. the debugtoolbar button on the right might turn out to be a visual issue if the website uses the same area. And especially in large projects the html code generated by the toolbar slows down the page rendering significantly.
debugtoolbar.intercept_redirects
trueif the redirection handler is enabled;falseif the handler is disabled. Default:false. This differs fromdebugtoolbar.enabled: it only enables or disables the redirection handler.
debugtoolbar.panels
A list of dotted Python global names to panel classes. Defaults to a list of all panel types known by
pyramid_debugtoolbar, as documented in pyramid_debugtoolbar API. If this is spelled in an.inifile, it should be a space- or newline-separated sequence of dotted Python names. For example:debugtoolbar.panels = pyramid_debugtoolbar.panels.versions.VersionDebugPanel pyramid_debugtoolbar.panels.settings.SettingsDebugPanel pyramid_debugtoolbar.panels.headers.HeaderDebugPanel pyramid_debugtoolbar.panels.request_vars.RequestVarsDebugPanel pyramid_debugtoolbar.panels.renderings.RenderingsDebugPanel pyramid_debugtoolbar.panels.logger.LoggingPanel pyramid_debugtoolbar.panels.performance.PerformanceDebugPanel pyramid_debugtoolbar.panels.routes.RoutesDebugPanel pyramid_debugtoolbar.panels.sqla.SQLADebugPanel pyramid_debugtoolbar.panels.tweens.TweensDebugPanel pyramid_debugtoolbar.panels.introspection.IntrospectionDebugPanel
debugtoolbar.button_style
Any inline css styles you want to apply to the toolbar button. This will override the default style (top:30px) set bytoolbar.css. If, for example, you want the toolbar button to show up at the bottom off the screen, just setdebugtoolbar.button_styleto ‘top:auto;bottom:30px;’. If you’re browser support the zoom property, you can even control the magnification level of the toolbar button (ie. ‘zoom:50%’).
debugtoolbar.exclude_prefixes
The debug toolbar won’t be shown if the PATH_INFO variable starts with any of the prefixes listed in this setting. If configuration is done via an .ini file, the prefixes should be separated by carriage returns. For example:
debugtoolbar.exclude_prefixes =
    /manage
    /settings
If configuration is done via Python, the setting should be a list. This setting was added in debugtoolbar version 1.0.4.
Custom authorization
Since version 1.0.5 pyramid_debugtoolbar offers custom
authorization mechanism to control toolbar feature on per-request basis.
Using config.set_debugtoolbar_request_authorization(callback) directive
you can specify own function to control whether toolbar functionality is enabled
or not.
Note
Custom authorization is performed after successful IP address check.
If debugtoolbar.hosts settings option is used.
Note
Custom authorization does not have effect on pyramid_debugtoolbar
static route and /_debug_toolbar/static/* contents will still be accessible.
from pyramid.security import authenticated_userid
from pyramid.settings import aslist

def admin_only_debugtoolbar(request):
    """
    Enable toolbar for administrators only.
    Returns True when it should be enabled.
    """
    admins = aslist(request.registry.settings.get('admins', ''))
    userid = authenticated_userid(request)
    toolbar_enabled = userid and userid in admins
    return toolbar_enabled

config = Configurator(.....)
config.include('pyramid_debugtoolbar')
config.set_debugtoolbar_request_authorization(admin_only_debugtoolbar)
The Toolbar
When you include the toolbar in your application, a floating toolbar logo will appear over your application’s HTML:
If you click on the “Pyramid DT” logo, the toolbar will expand:
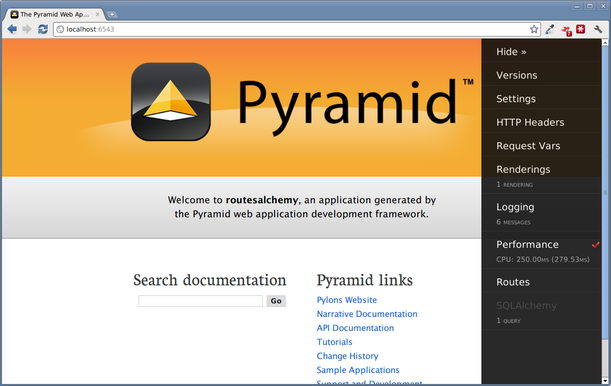
Toolbar Panels
These are the default toolbar panels:
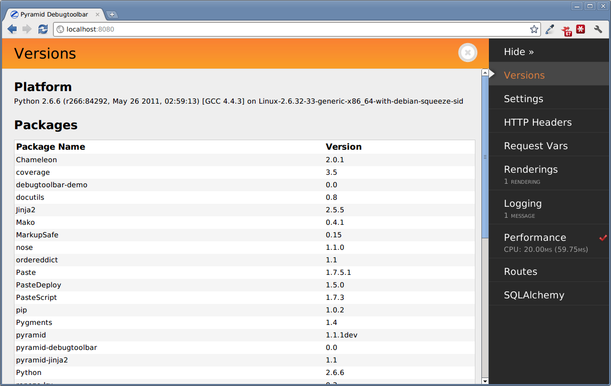
Versions
Displays versions of all installed Python software as well as the Python version and platform itself.
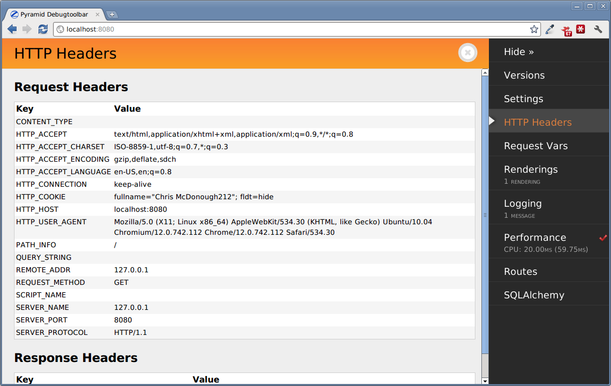
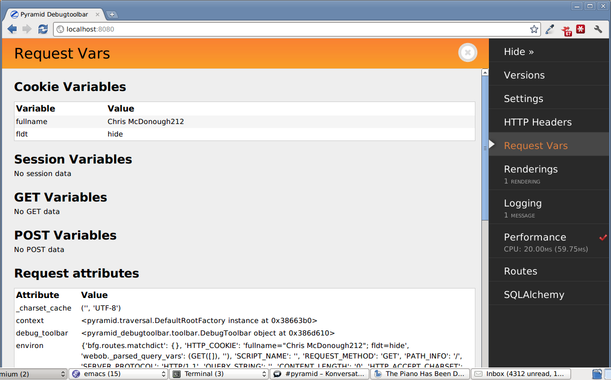
Request Vars
Displays objects attached to the request of the current page and the WSGI environment.
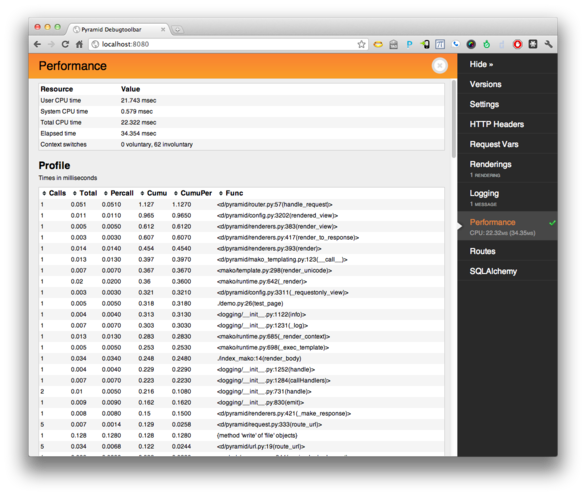
Performance
Displays timing information, and, if enabled, Python profiling information for the current page. When the checkbox on the performance panel is green, the request will be profiled and profiling information will be gathered and displayed on the panel output. When it is red, only timing will be done and no profiling information will be captured.
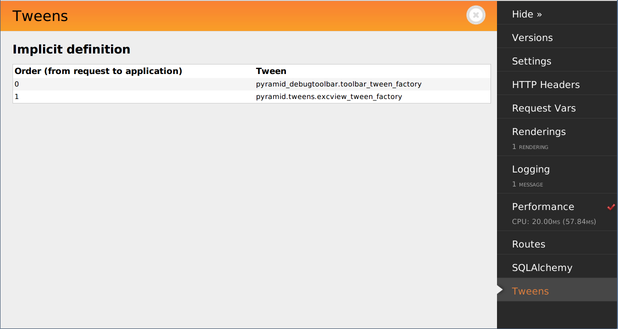
Tweens
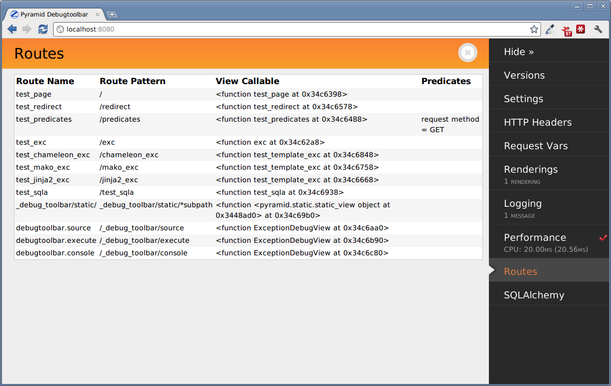
Displays the tween chain for your application, and whether they were defined explicitly or implicitly.
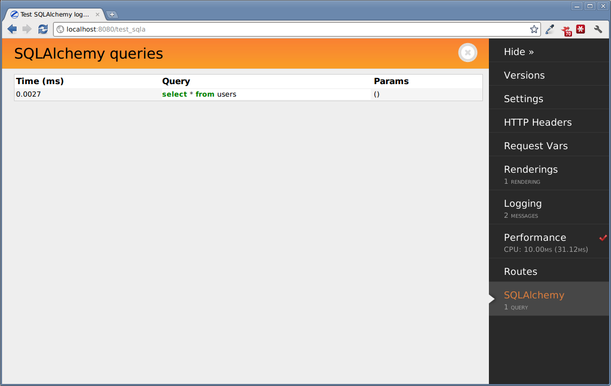
SQLAlchemy
Displays SQL queries made by SQLAlchemy by the current page along with timing information.
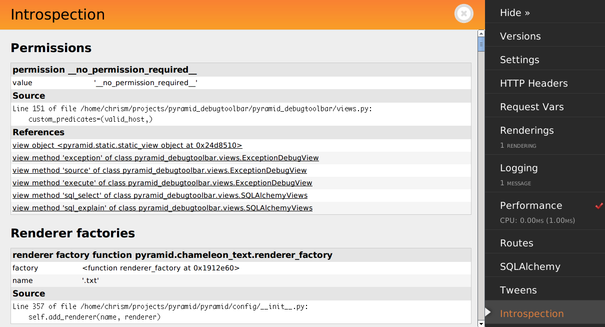
Introspection
Displays a rendering of the data available in Pyramid’s configuration introspection system (available in Pyramid 1.3+ only).
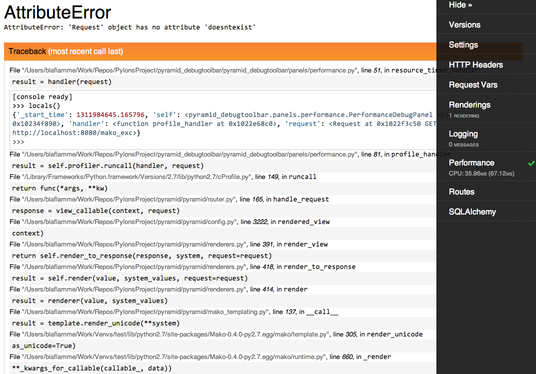
Exception Handling
When an exception is raised and the debugtoolbar.intercept_exc setting is
display or debug, Pyramid presents a pretty traceback page. If the
setting value is debug, you will be able to examine locals in each frame
in the traceback and execute code in the context of each frame. Read the
instructions on the exception page for more information.
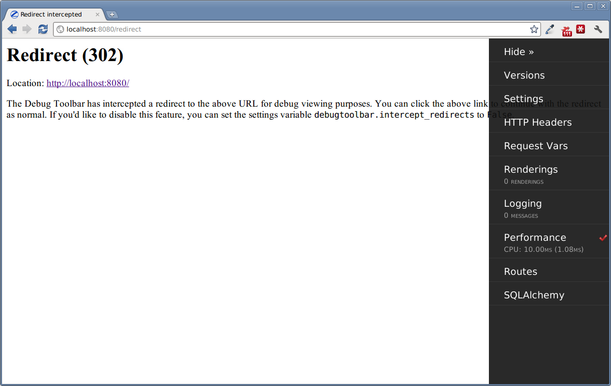
Redirect Handling
When a response is returned to Pyramid that has a redirect status code (301,
302, etc) and the debugtoolbar.intercept_redirect setting is true,
Pyramid presents an interim page with a link to the target of the redirect.
You can use the toolbar on the redirect source page, then when finished, use
the link to continue to the target page.
Adding custom panels
In some cases it can be desirable to add a custom panel to the toolbar to display some application specific data. There are two steps for adding such a panel to an application: writing the panel and adding it to your application settings.
Writing the panel
The panel can be created as part of your application or as a standalone
package. The easiest way to write a panel is to subclass from the
pyramid_debugtoolbar.panels.DebugPanel class. Here is the code for a
sample panel:
from pyramid_debugtoolbar.panels import DebugPanel

_ = lambda x: x

class SampleDebugPanel(DebugPanel):
    """
    Sample debug panel
    """
    name = 'Sample'
    has_content = True

    def nav_title(self):
        return _('Sample')

    def url(self):
        return ''

    def title(self):
        return _('Sample')

    def content(self):
        vars = {'somelist':['sample value', 'another value']}
        return self.render(
            'samplepanel:templates/sample.mako',
            vars, self.request)

def includeme(config):
    config.registry.settings['debugtoolbar.panels'].append(SampleDebugPanel)
    if not 'mako.directories' in config.registry.settings:
        config.registry.settings['mako.directories'] = []
After inheriting from the DebugPanel class, you have to define a few methods on your panel:
nav_title
Returns a function that can be called to get the title to be used on the toolbar’s navigation bar for this panel.
url
This is not used at the moment, but it has to be provided because the base class will raise NotImplemented if it’s not there.
title
Returns a function that can be called to get the title to be used on the panel’s display page.
content
Returns the panel’s content for display. It can return an HTML response directly, but normally it’s better to use a template, like in the example.
Once you define the panel it has to be added to the debugtoolbar.panels
setting of the configuration. A good way to do this is to use an includeme
method in the panel’s __init__.py.
Configuring an application to use the panel
Once your panel is ready, you can simply add its package name to the
pyramid.includes setting on your application configuration file:
pyramid.includes = pyramid_debugtoolbar samplepanel
More Information
Reporting Bugs / Development Versions
Visit http://github.com/Pylons/pyramid_debugtoolbar to download development or tagged versions.
Visit http://github.com/Pylons/pyramid_debugtoolbar/issues to report bugs.