
pyramid_debugtoolbar
Overview
pyramid_debugtoolbar provides a useful debug toolbar while you're
developing a Pyramid application.
The toolbar is a blatant rip-off of Michael van Tellingen's
flask-debugtoolbar (which itself was derived from Rob Hudson's
django-debugtoolbar). It also includes a lightly sanded down version of
the Werkzeug debugger code by Armin Ronacher and team.
Installation
Install using pip, e.g. (within a virtualenv):
$ pip install pyramid_debugtoolbar
Setup
Once the pyramid_debugtoolbar is installed, you must use the
config.include mechanism to include it into your Pyramid project's
configuration:
config = Configurator(.....)
config.include('pyramid_debugtoolbar')
Alternately, you may activate the toolbar by changing your application's
.ini file by adding it to the pyramid.includes list:
pyramid.includes = pyramid_debugtoolbar
Warning
The debug toolbar should never be enabled in a production environment or on a machine with its Pyramid HTTP port exposed directly to the internet; it allows arbitrary code execution from only semi-trusted sources when configured poorly.
Usage
Once Pyramid is restarted, the toolbar will be available to inspect requests
and responses by the application by visiting the /_debug_toolbar/ URL
(note the trailing slash). For example, if your application is available at
http://localhost:6543/ then you may visit
http://localhost:6543/_debug_toolbar/ to inspect the requests.
For any HTML responses generated by the application, a link to the toolbar
for the current page will be available in the upper right corner, provided
the response contains a closing </body> tag.
Debugging Unhandled Exceptions
If an exception is unhandled by the Pyramid application, the toolbar will catch it and render an HTML page with a traceback and an interactive debugger that can be used to dive into the stack and execute arbitrary Python expressions to inspect the state of the system.
A URL leading to a debugging page for each exception raised by your application will additionally be logged to the console.
Settings
Settings can be used to control the operation of the toolbar. These settings
are typically specified in the Pyramid "app" section of the Pyramid .ini
file.
debugtoolbar.hosts
If the request's
REMOTE_ADDRis not in this list, the toolbar will not be displayed and the exception handler will not be active. Default value is['127.0.0.1', '::1']. Note that each of the values in the list can be a hostmask, e.g.,192.168.1.0/24.This should be a list if setup is done in Python or, if defined in a Paste
.inifile, a single-line list of IP addresses/hostmasks separated by spaces. For example:debugtoolbar.hosts = 192.168.1.1 192.168.2.0/24To enable access from any host, use the hostmask
0.0.0.0/0.
debugtoolbar.enabled
trueif the toolbar is enabled;falseif the toolbar is disabled. Default istrue. This disables both the exception handler and the toolbar overlay.
debugtoolbar.includes
The debugtoolbar will use Pyramid's default
pyramid.config.Configurator.include()mechanism to extend the toolbar's internal Pyramid application with custom logic. This is a good spot to add custom panels, affect static assets used by the toolbar, or add custom urls.Within the
includemethe application registry may be accessed asconfig.registry.parent_registry.
debugtoolbar.intercept_exc
This setting can have one of three values:
display,debugorfalse. Default isdebug. If this value isdisplay, the toolbar will display a "pretty" traceback page which allows source viewing and when an exception happens. If this value isdebug, the "pretty" traceback page will be shown, but it will also contain interactive debugging controls which allow you to evaluate arbitrary Python expressions in the context of a portion of the traceback, which is useful when attempting to track down the cause of the exception. If this value isfalse, the "pretty" traceback will be disabled and all exceptions will be raised to the caller of the Pyramid application (usually a WSGI server). Default isdebug. This setting differs fromdebugtoolbar.enabled: it only enables or disables the exception handler. Note that, for backwards compatibility purposes, the valuetrueprovided to this setting is interpreted asdebug.
debugtoolbar.show_on_exc_only
Default is
false. If set totruethe debugtoolbar will only be injected into the response in case a exception is raised. If the response is processed without exception, the returned html code is not changed by the debugtoolbar at all. This option allows the developer to use the toolbar for debugging purposes without interfering with successful responses.Inspection of requests is still possible by visiting the toolbar manually at
/_debug_toolbar/.
debugtoolbar.intercept_redirects
trueif the redirection handler is enabled;falseif the handler is disabled. Default isfalse. This differs fromdebugtoolbar.enabled: it only enables or disables the redirection handler.
debugtoolbar.panels
A list of panel names. Defaults to a list of all panels known by
pyramid_debugtoolbar, as documented in pyramid_debugtoolbar API. If this is spelled in an.inifile, it overrides the default list and should be a space- or newline-separated sequence of panel names. This setting should be mainly used to override the default order of panels. For example:debugtoolbar.panels = headers logging performance renderings request_vars sqlalchemy tracebackFor compatibility with older versions of the toolbar, the panel name may also be the dotted Python path to the panel class. For example,
pyramid_debugtoolbar.panels.sqla.SQLADebugPanel.
debugtoolbar.extra_panels
A list of panel names that will be appended to the
debugtoolbar.panelslist. This setting is mostly useful if you have a panel that is not included by default (usingdebugtoolbar.includesand you do not want to maintain the list of all panels viadebugtoolbar.panels). This may be a dotted Python path to the panel class.
debugtoolbar.global_panels
A list of panel names. Defaults to a list of all global panels known by
pyramid_debugtoolbar, as documented in pyramid_debugtoolbar API. If this is spelled in an.inifile, it overrides the default list and should be a space- or newline-separated sequence of panel names. For example:debugtoolbar.panels = introspection routes settings tweens versionsFor compatibility with older versions of the toolbar, the panel name may also be the dotted Python path to the panel class. For example,
pyramid_debugtoolbar.panels.settings.SettingsDebugPanel.
debugtoolbar.extra_global_panels
A list of panel names that will be appended to the
debugtoolbar.global_panelslist. This setting is mostly useful if you have a panel that is not included by default (usingdebugtoolbar.includesand you do not want to maintain the list of all panels viadebugtoolbar.panels). This may be a dotted Python path to the panel class.
debugtoolbar.button_style
Any inline css styles you want to apply to the toolbar button. This will override the default style (
top:30px;) set bytoolbar.css. If, for example, you want the toolbar button to show up at the bottom off the screen, just setdebugtoolbar.button_styletotop:auto;bottom:30px;. If your browser supports the zoom property, you can even control the magnification level of the toolbar button, e.g.,zoom:50%;.
debugtoolbar.exclude_prefixes
The debug toolbar won't be shown and no data will be recorded if the
PATH_INFOvariable starts with any of the prefixes listed in this setting. If configuration is done via an.inifile, the prefixes should be separated by carriage returns. For example:debugtoolbar.exclude_prefixes = /favicon.ico /settings /staticIf configuration is done via Python, the setting should be a list.
By default, the setting is
['/favicon.ico'].
debugtoolbar.active_panels
A space-separated list of panel names (see
pyramid_debugtoolbar.panels.DebugPanel.name). This list of panels will have theirpyramid_debugtoolbar.panels.DebugPanel.is_activestate set toTruealways. For example:debugtoolbar.active_panels = performanceThis will set the listed panels to always be active. Instead, in order to enable per-request activation see Activating Panels.
debugtoolbar.max_request_history
The debug toolbar works by storing the original request and its associated data in memory, and making this data available to subsequent requests. By default, the toolbar maintains a history of the last 100 requests made to the application. By setting
debugtoolbar.max_request_history, one can override the default of 100 and set it to a different number.
debugtoolbar.max_visible_requests
The number of requests shown in the sidebar. The default is 10.
Useful settings for debugging panels/debugtoolbar
When developing custom panels for an application, the following settings may be used to influence how debugtoolbar itself behaves and what information it logs.
debugtoolbar.debug_notfound
Print view-related
NotFounddebug messages tostderrwhen this value istrue.
debugtoolbar.debug_routematch
Print debugging messages related to URL dispatch route matching when this value is
true.
debugtoolbar.reload_templates
When this value is
true, templates are automatically reloaded whenever they are modified without restarting the application, so you can see changes to templates take effect immediately during development. This flag is meaningful to Chameleon and Mako templates, as well as most third-party template rendering extensions.
debugtoolbar.reload_resources
Alias for
debugtoolbar.reload_assets.
debugtoolbar.reload_assets
Don't cache any asset file data when this value is
true.
debugtoolbar.prevent_http_cache
Prevent the
http_cacheview configuration argument from having any effect globally in this process when this value istrue. No HTTP caching-related response headers will be set by the Pyramidhttp_cacheview configuration feature when this istrue.
Disable squashed exception information
You can control the level of printed exceptions from pyramid_debugtoolbar by adding a custom logger configuration.
[loggers]
keys = root, debugtoolbar

[logger_debugtoolbar]
level = WARN
qualname = pyramid_debugtoolbar
Activating Panels
Most panels do not support any extra active features and need not be
explicitly activated. However, some panels support an optional
is_active state in which they
will do some extra work. For example, the
PerformanceDebugPanel
will not do profiling of your requests unless it has been activated.
This activation can be controlled on a per-request basis by setting the
pdtb_active cookie to a comma-separated list of panel names.
For example:
Cookie: pdtb_active=performance,session,foo,bar
A panel name is defined by the
name attribute of each
debug panel.
The cookie may also be set via the web interface in the Settings tab but, remember, since it is a cookie it must be set on the exact HTTP client you are using or the panel will not be active for the request.
The Toolbar
When you include the toolbar in your application, a floating Pyramid logo will appear on the upper right over your application's HTML:
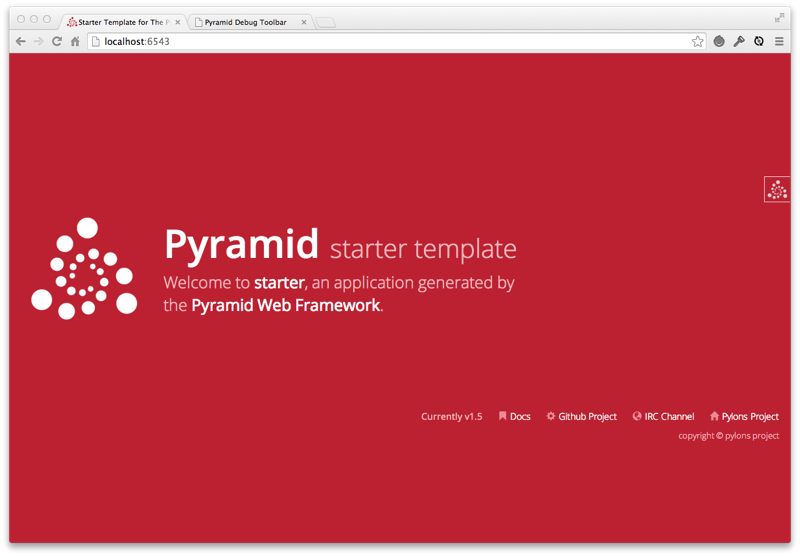
If you click on the Pyramid logo, a new target window will open with your current request highlighted and all of your configured panels loaded.
Toolbar Panels
These are the default toolbar panels:
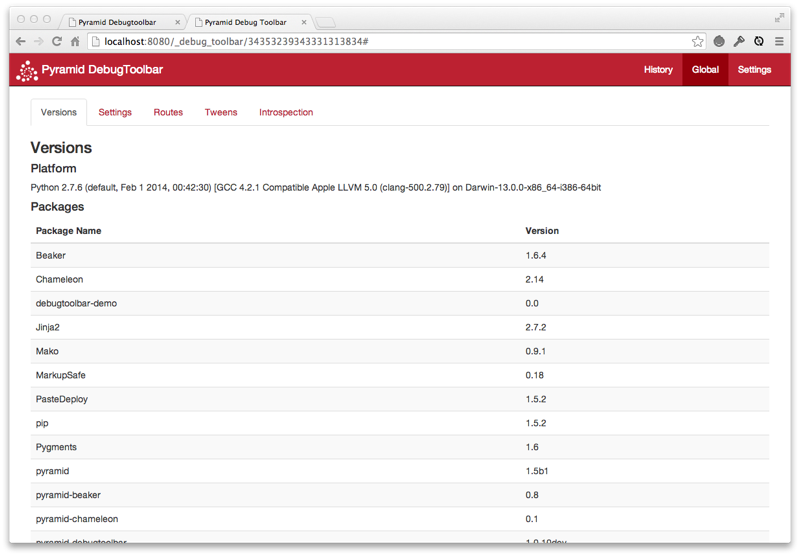
Versions
Displays versions of all installed Python software as well as the Python version and platform itself.
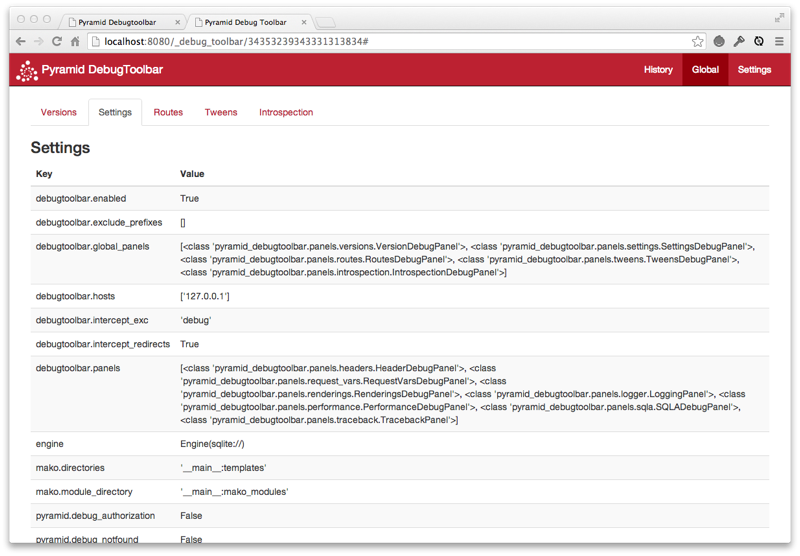
Settings
Displays your Pyramid application's deployment settings, i.e., registry.settings.
See also
For realtime customization of the toolbar and its panels, use the Settings tab in the navigation bar. See Toolbar Settings.
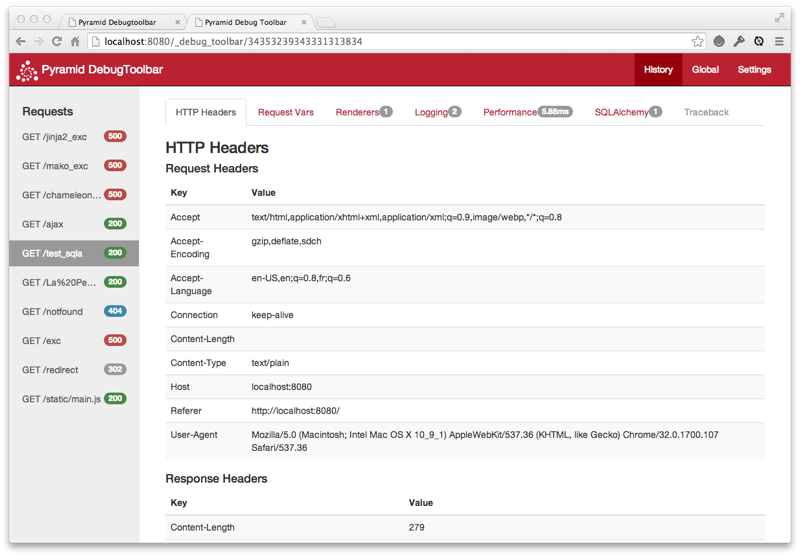
HTTP Headers
Displays HTTP request and response headers for the current page.

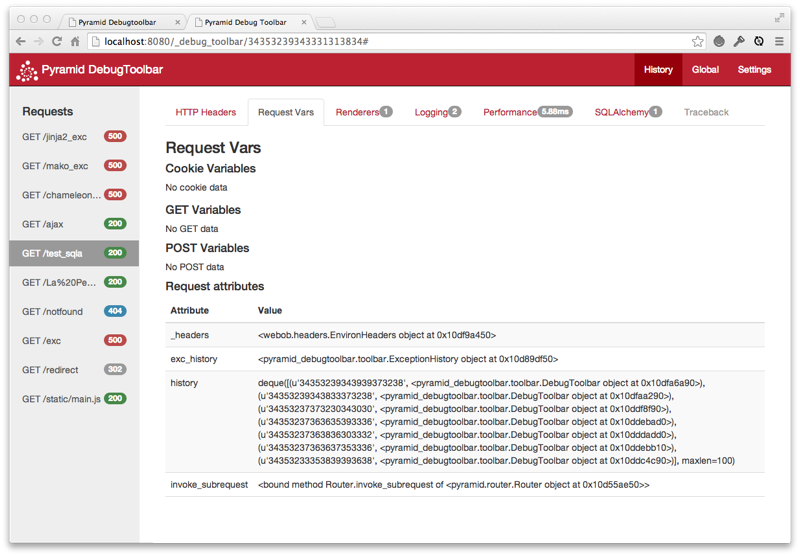
Request Vars
Displays objects attached to the request of the current page and the WSGI environment.
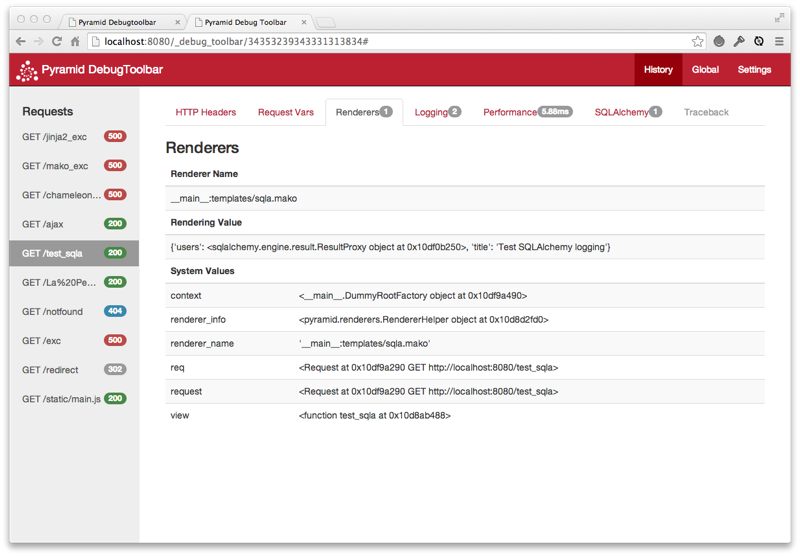
Renderings
Displays the renderings performed by Pyramid for the current page.
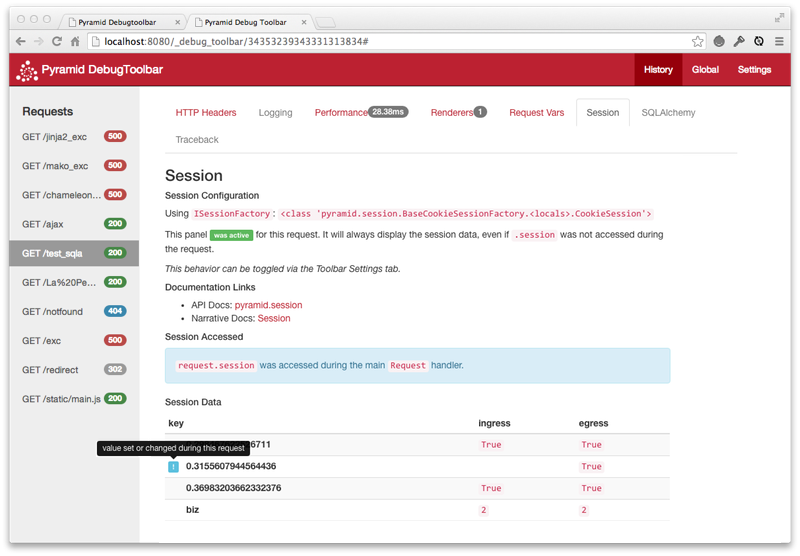
Session
Displays ingress and egress session data if the session was accessed during the request.
Displays a status message indicating whether or not the session was accessed during the request.
Advanced functionality: If the panel is enabled, the ingress and egress session data will always be tracked and displayed, regardless of the session having been accessed during the request. This advanced usage is offered to aid developers in complex debugging scenarios. Most users will not need this enabled.
There are two ways to enable the extended session display used by the Session panel.
Under the Settings tab in the navigation bar, click the red X mark. When there is a green check mark, each request will have the ingress and egress data tracked and displayed on the Settings panel output regardless of the session being accessed during the request. When there is a red X mark, only requests which accessed the session will have the ingress and egress data displayed. See Toolbar Settings.
Send a
pdtb_activecookie on a per-request basis. This panel's name for cookie activation is "session". See Activating Panels.
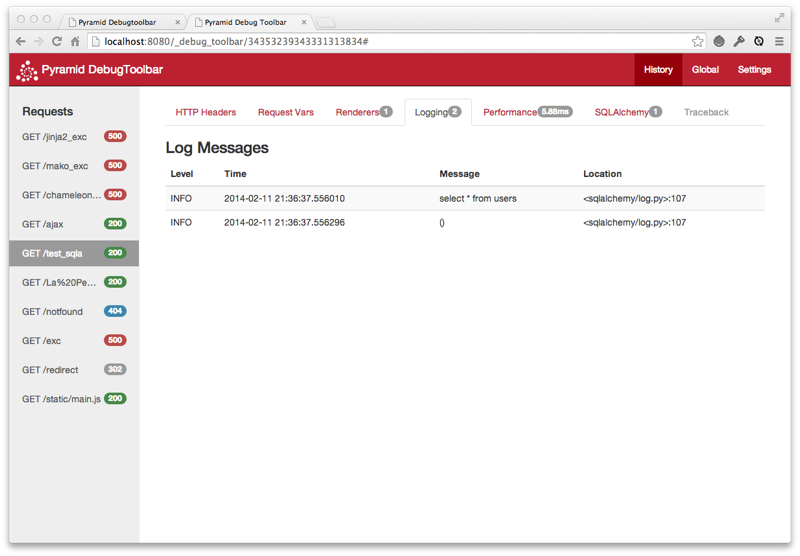
Logging
Displays messages logged by the current page.
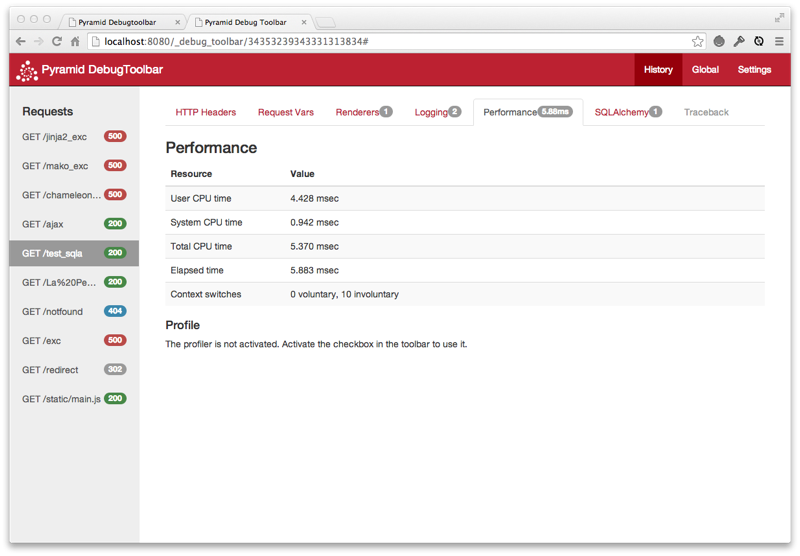
Performance
Displays timing information, and, if enabled, Python profiling information for the current page. When it is red, only timing will be done and no profiling information.
There are two ways to enable the internal profiler used by the Performance panel.
Under the Settings tab in the navigation bar, click the red X mark. When there is a green check mark, each request will be profiled and profiling information will be gathered and displayed on the Performance panel output. See Toolbar Settings.
Send a
pdtb_activecookie on a per-request basis. This panel's name for cookie activation is "performance". See Activating Panels.
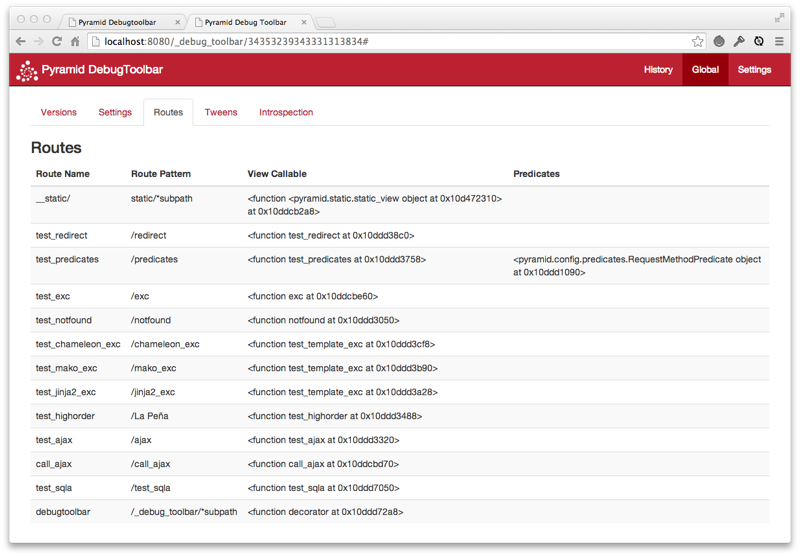
Routes
Displays the routes currently configured in your application.
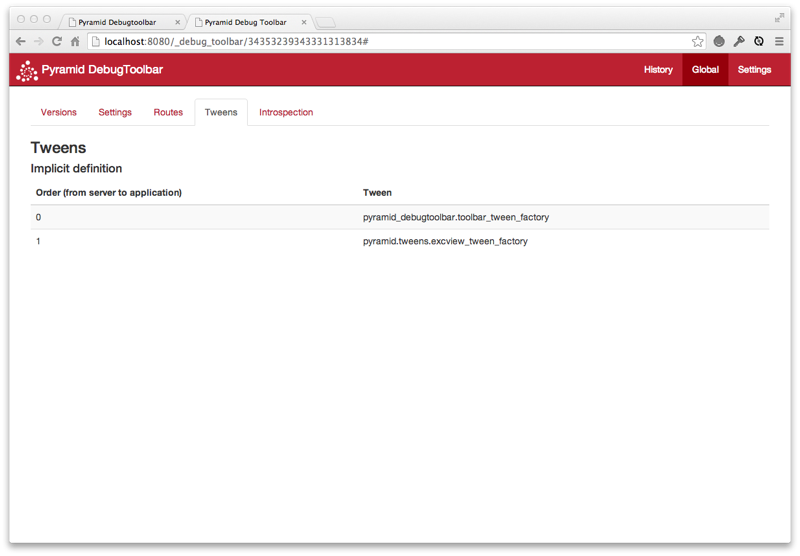
Tweens
Displays the tween chain for your application, and whether they were defined explicitly or implicitly.
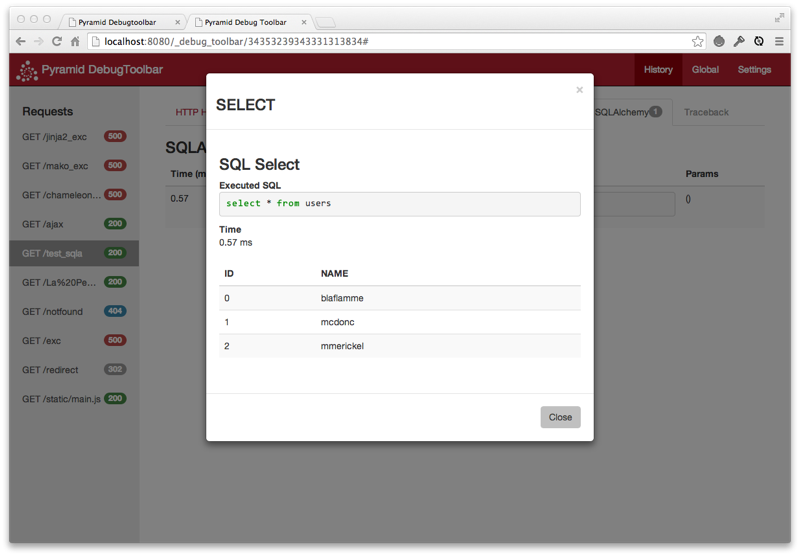
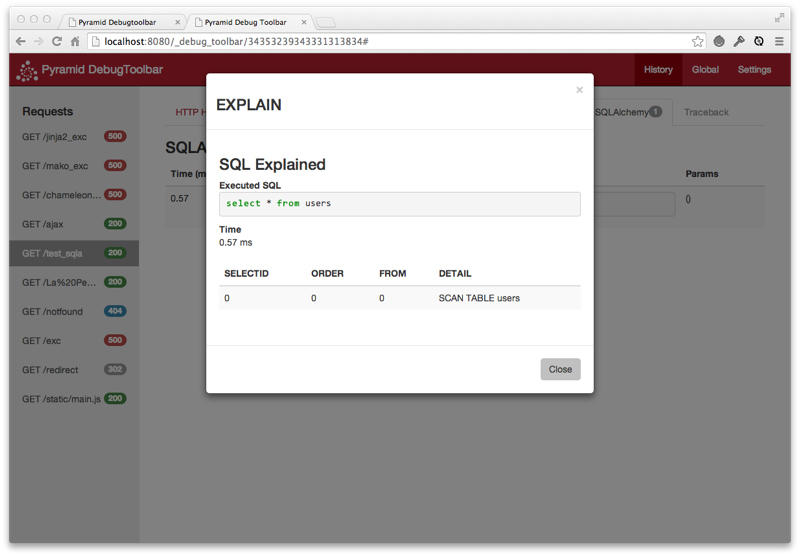
SQLAlchemy
Displays SQL queries made by SQLAlchemy by the current page along with timing information.
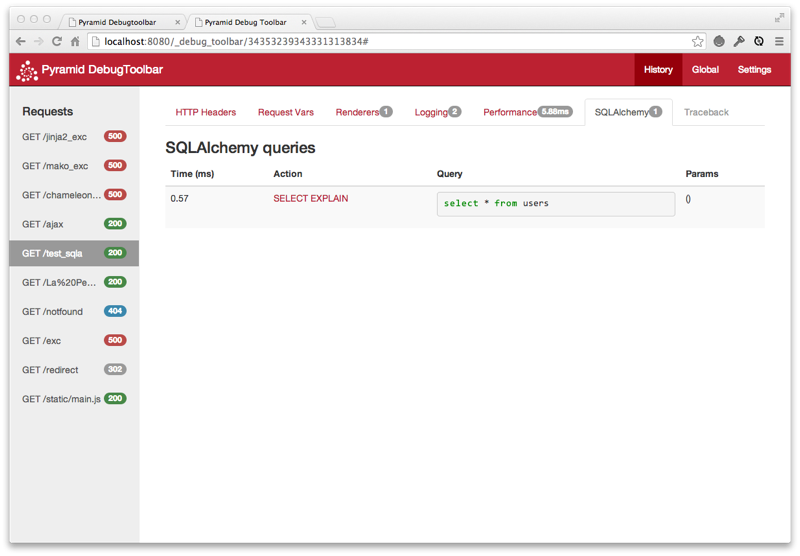
Provides the ability to re-run the query using the "SELECT" link.
Provides the ability to get more detail about the query using the "EXPLAIN" link.
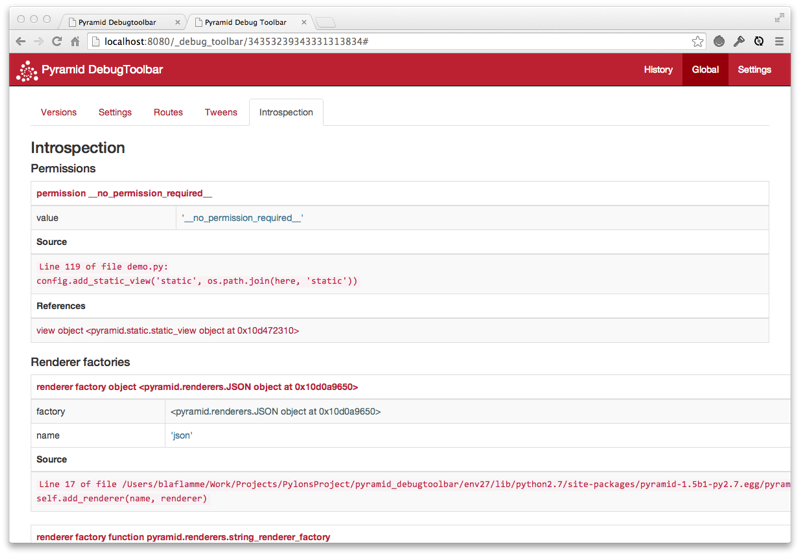
Introspection
Displays a rendering of the data available in Pyramid's configuration introspection system (available in Pyramid 1.3+ only).
Toolbar Settings
The Settings tab allows for realtime customization of the toolbar and its panels.
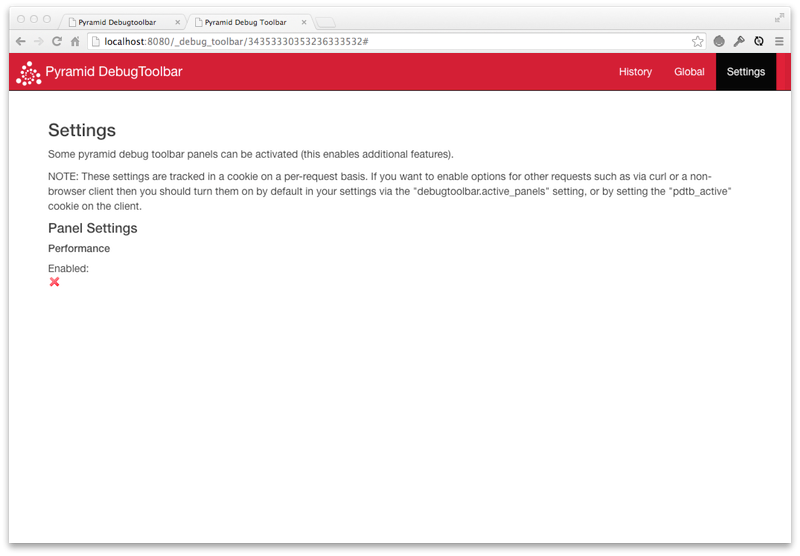
See also
To display your Pyramid application's settings, see Settings panel.
Performance Debug Panel
An internal profiler can be enabled under the Settings tab in the navigation bar. Click the red X mark to enable the profiler. When the mark is a green check, the request will be profiled and profiling information will be gathered and displayed on the Performance panel output. See Performance panel.
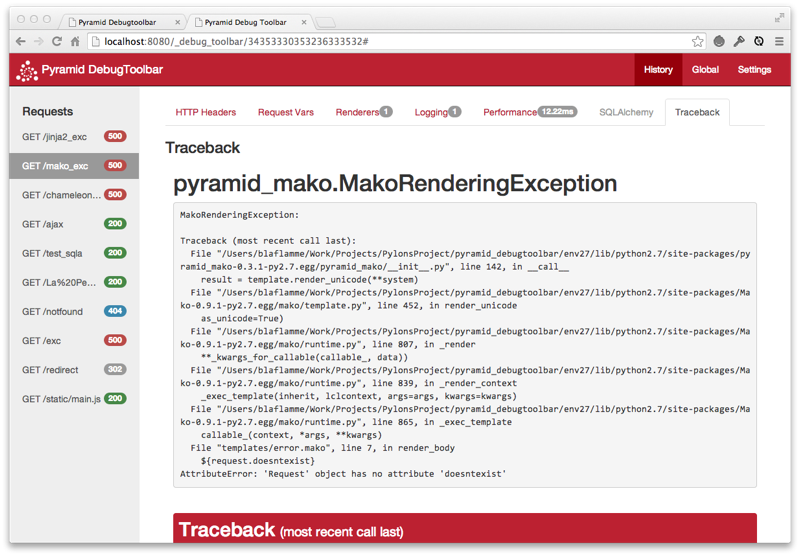
Exception Handling
When an exception is raised and the debugtoolbar.intercept_exc setting is
display or debug, Pyramid presents a pretty traceback page. If the
setting value is debug, you will be able to examine locals in each frame
in the traceback and execute code in the context of each frame. Read the
instructions on the exception page for more information.
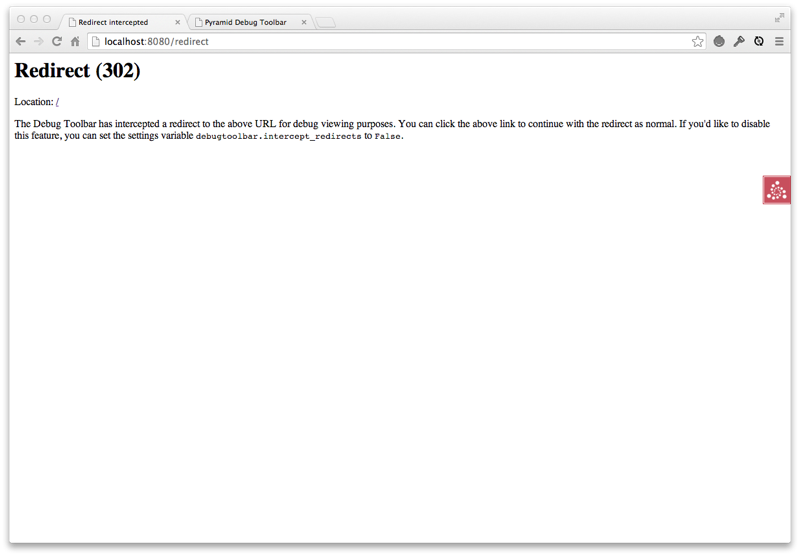
Redirect Handling
When a response is returned to Pyramid that has a redirect status code (301,
302, etc.) and the debugtoolbar.intercept_redirect setting is true,
Pyramid presents an interim page with a link to the target of the redirect.
You can use the toolbar on the redirect source page, then when finished, use
the link to continue to the target page.
Adding custom panels
In some cases it can be desirable to add a custom panel to the toolbar to display some application specific data. There are two steps for adding such a panel to an application: writing the panel, and adding it to your application settings.
Understanding how debugtoolbar works
Before writing the panel, you should understand how pyramid_debugtoolbar interacts with your application in its two phase process.
pyramid_debugtoolbar wraps every request within a Pyramid "tween" via
toolbar_tween_factory. This tween allows the toolbar to record data during
the original request (Phase 1) and injects a link to the toolbar interface
into the rendered Pyramid web pages. The data is displayed during a secondary
request to the toolbar (Phase 2).
Phase 1 - The original request
When pyramid_debugtoolbar is enabled, it can start tracking data on the original request. This involves calling the following panel methods in-band with the original request:
These methods are used to store and manipulate a self.data variable on each
panel during this original request. Typically self.data is first generated
on the __init__ method. It is important to note that the request and
event variables available to these methods refer to the original request.
Phase 2 - The debugtoolbar request
When the "/_debug_toolbar/{request_id}" is accessed, the history of the original
request_id and its associated panels are accessed. Variables such as data
that were generated during the original request are made available for further
processing. The data variable is injected into the template for display.
The following panel methods are called or accessed on the debugtoolbar request:
Writing the panel
The panel can be created as part of your application or as a standalone
package. The easiest way to write a panel is to subclass from the
pyramid_debugtoolbar.panels.DebugPanel class. Here is the code for a
sample panel:
from pyramid_debugtoolbar.panels import DebugPanel

_ = lambda x: x

class SampleDebugPanel(DebugPanel):
    """
    Sample debug panel
    """
    name = 'Sample'
    has_content = True
    template = 'myapp.lib.debugtoolbar_custom.panels:templates/sample.dbtmako'

    def __init__(self, request):
        self.data = { 'request_path' : request.path_info }

    @property
    def nav_title(self):
        return _('Sample')

    @property
    def title(self):
        return _('Sample')

def includeme(config):
    config.add_debugtoolbar_panel(SampleDebugPanel)
After inheriting from the DebugPanel class, you have to define a few
methods and attributes on your panel:
nameAttribute. String value. A unique identifier for the name of the panel. This must be defined by a subclass.
has_contentAttribute. Boolean value. Default is
TrueThis attribute determines if the tab is enabled or not. IfFalsethen the panel's tab will be disabled and.render_contentwill not be invoked. Most subclasses will want to set this toTrueby default. An example of this panel's dynamic utility is the SQLA panel; if no SqlAlchemy statements were executed in the request, this value is set toFalseand the tab is simply disabled.user_activateAttribute. Boolean value. If the client is able to activate/de-activate the panel then this should be
True.is_activeAttribute. Boolean value. This property will be set by the toolbar, indicating the user's decision to activate or deactivate the panel. If
user_activateisFalsethenis_activewill always be set toTrue.templateAttribute. String value. Must be overridden. A mako asset specification. The default implementation of
render_contentin the base class (DebugPanel) will attempt to rendertemplate. Iftemplateis not defined, andrender_contentis not overridden, aNotImplementedexception will be raised.nav_titleMethod. Returns a string. Called to get the title to be used on the toolbar's navigation bar for this panel.
urlMethod. Returns a string. Can be overridden to point the panel at any arbitrary URL when the tab is clicked.
titleMethod. Returns a string. Called to get the title to be used on the panel's display page.
__init__Method. This method should defines a
dataattribute, which is used when rendering the template. This is the first (and often most appropriate) opportunity to initializedatawith values that can be derived from the request object itself.render_contentMethod. Return a string containing the HTML to be rendered for the panel. By default this will render the template defined by the
templateattribute with a rendering context defined by thedataattribute combined with thedictreturned fromrender_vars. Therequesthere is the active request in the toolbar. Not the original request that this panel represents.render_varsMethod. Invoked by the default implementation of
render_contentas an opportunity to enhance the rendering context. This method is expected to return adictof values to use when rendering the panel's HTML content. This value is usually injected into templates as the rendering context. This is a useful hook for adding any data you need in the templates, which was not already added into the panel's.`data`. The default SQLA panel is a good example of this functionality in use. Therequesthere is the active request in the toolbar. Not the original request that this panel represents.wrap_handlerMethod. This method is a hook available to the panel in order to track the lifecycle of the original request. A handler accepts a request and returns a response; it is essentially the same as a Pyramid
tween. This can be used to update thedatadict with values that are wanted for rendering. The main toolbar routine works by wrapping each request in a handler (tween). Before generating a response, the main toolbar routine will call the`wrap_handler` method of each panel. This functionality is often used for decorating the handlers with timing or performance metrics.process_beforerenderMethod. Arguments:
self,event. This method is a hook available to the panel in order to track the lifecycle of the original request. The debugtoolbar uses a subscriber event (pyramid.events.BeforeRender) to call theprocess_beforerendermethod of each enabled panel. This can be used to update thedatadict with values that are wanted for rendering or track properties of the rendering events.process_responseMethod. Arguments:
self,response. This method is a hook available to the panel in order to track the lifecycle of the original request. The main toolbar routine works by wrapping each request in a tween. Theprocess_responsemethod of each panel is called within the tween, after the original request has generated a response.
When creating a new panel, some of these methods must be subclassed, while others can rely on the base class.
Once you define the panel it should be registered with the toolbar by defining
an includeme function that calls
pyramid_debugtoolbar.add_debugtoolbar_panel() and then having the user
add the panel to their debugtoolbar.includes setting in their app.
The source code for the standard debugpanel request_vars.py is a good
starting point for inspiration.
The render_vars and render_content methods may use the
request.toolbar_panels dictionary to introspect and work with other panels
that captured data for the original request. The dictionary keys are the names
of other panels and the values are the panel instances.
Configuring an application to use the panel
Once your panel is ready, you can simply add its package name to the
debugtoolbar.includes setting on your application configuration file:
pyramid.includes =
    pyramid_debugtoolbar

debugtoolbar.includes =
    samplepanel
Executing actions in the parent app
It may be the case that your panel needs to instrument the parent application
with extra settings or configuration. For example, maybe it wants to wrap the
session factory with its own. To make this happen, your includeme that
is included from debugtoolbar.includes should use
pyramid_debugtoolbar.inject_parent_action() to register a callable
that can modify the parent application.
from pyramid.interfaces import ISessionFactory
import time

class SessionFactoryWrapper:
    def __init__(self, factory):
        self.factory = factory

    def __call__(self, request):
        request.session_created_at = time.time()
        return self.factory(request)

def includeme(config):
    def action(parent_config):
        factory = parent_config.registry.queryUtility(ISessionFactory)
        if factory:
            wrapped_factory = SessionFactoryWrapper(factory)
            parent_config.set_session_factory(wrapped_factory)
    config.inject_parent_action(action)
In this example, you may also register a new toolbar panel that cares about
request.session_created_at to determine when the session was created
during the request lifecycle.
JavaScript and CSS Available to Custom Panels
pyramid_debugtoolbar automatically loads several Javascript and CSS
libraries that you can take advantage of when writing custom panels.
Bootstrap [http://getbootstrap.com/]
jQuery [https://jquery.org/]
jquery.tablesorter [http://mottie.github.io/tablesorter]
If you wish to enable tablesorting, add the CSS class "pDebugSortable" to the
opening <table> tag. For example:
<table class="pDebugSortable table table-striped table-condensed">
Panel and UI Extras
The following is a listing of panels and user interface extras for
pyramid_debugtoolbar created by its users. These extras are unofficial and
not supported by the Pylons Project. To add your contribution, please submit a
pull request to update this documentation.
- Page Up
For tabs that have content which requires lots of scrolling down or to the right, clicking the Page Up icon resets the window to 0,0.
- pyramid_debugtoolbar_ajax
Adds an "AJAX" panel to the
pyramid_debugtoolbar. This panel contains a button to replay the request in a new window -- allowing you to spawn a debugger window for errors encountered on background ajax requests.- pyramid_debugtoolbar_dogpile
dogpile caching support for pyramid_debugtoolbar.
- pyramid_mongodb2_debugtoolbar
pymongo integration and debugging support pyramid_debugtoolbar. Shows detailed information about queries, connection, databases and their collections.
More Information
Development Versions
Visit https://github.com/Pylons/pyramid_debugtoolbar to download development or tagged versions.
Reporting Bugs
Visit https://github.com/Pylons/pyramid_debugtoolbar/issues to report bugs.